Nineteen Percent: How Tokyo’s Emission Trading Scheme Cuts Carbon and Supports Climate Action
In terms of both gross domestic product (GDP) and carbon emissions, the city of Tokyo ranks alongside entire nations. The mass of carbon it releases every year falls somewhere between the mass emitted by all of Denmark and Sweden, and it has a GDP larger than that of Canada or Spain. Because of this global scale, Tokyo has the unique opportunity to highlight the role urban initiatives can play in supporting nationally determined contributions (NDCs) worldwide.
Tokyo’s domestic emissions trading scheme (ETS) has produced significant results in reducing emissions over the past eight years. Through this scheme, Tokyo is demonstrating that it is possible to simultaneously pursue aggressive sustainability policies while maintaining a healthy economy. This “decoupling” of energy consumption and production is an important milestone in the economics of sustainable development. This is relevant not only for local governments, but also for the NDCs that nations around the world will update by 2020. If local governments can demonstrate economic decoupling, national governments may be able to follow suit.
Tokyo’s ETS involves the mandatory participation of approximately 1,300 large-size facilities which collectively account for roughly 40 percent of the city’s emissions from industrial and commercial sectors. Since the project’s implementation, the city reports that greenhouse gas (GHG) emissions from these facilities has fallen 27 percent compared to baseline emissions established between 2002-2007. This correlates with a city-wide survey of emissions reductions conducted in 2005 which found a reduction of 19.5 percent across all sectors of the city compared to levels in 2000.
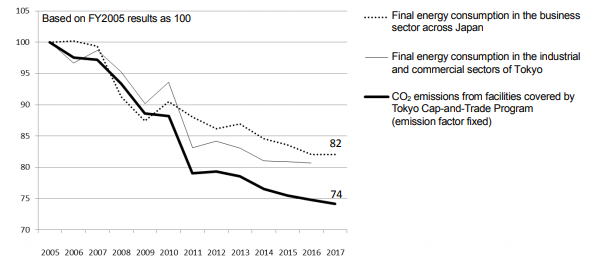
Figure 1: A review of emissions from 2005 to 2017 found a city-wide reduction of 18 percent
Just as impressively, the Tokyo Metropolitan Government has demonstrated that emissions reductions have been achieved without disrupting the city’s economic growth – as depicted in Figure 2.
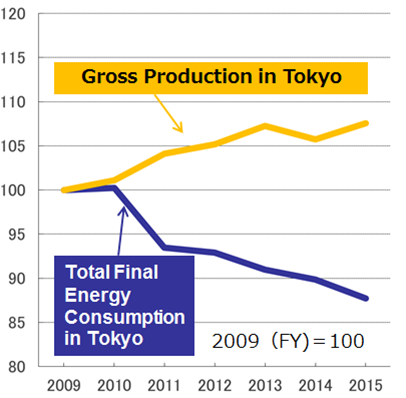
Figure 2: Gross production and overall energy consumption decoupled sharply after the plan was put in place.
Since the plan’s implementation in 2010, economic growth has continued in a stable fashion, even with the plan being implemented shortly after the economic downturn of 2008.
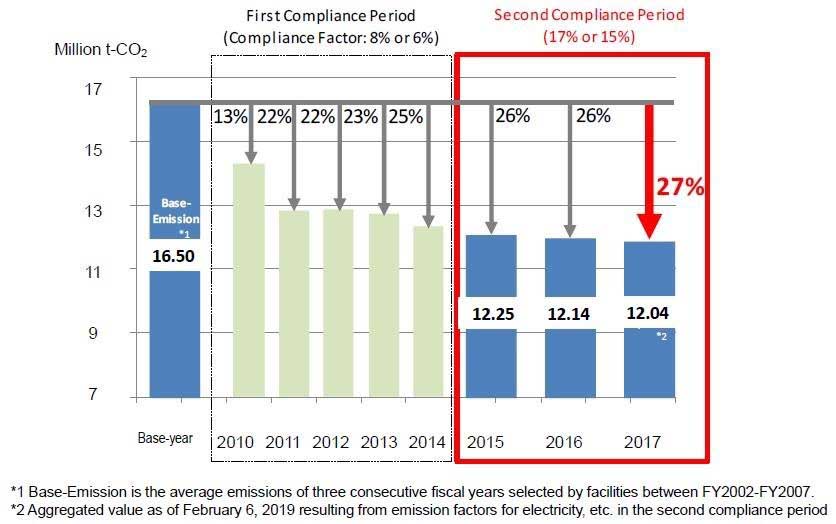
Figure 3: Tokyo’s plan is broken up into five-year compliance periods.
How It Works
Tokyo has been successful in lowering emissions through emissions trading for many reasons. But a key reason for its success is the clear validation of the methods facilities can use to earn mitigation credits — a measure of how carbon a facility’s actions have offset — to ensure ecological losses are compensated
For example, facilities can report the acquisition of high-efficiency equipment and lights to earn credit, or purchase electricity and heating services from certified low-emissions service providers. Because these mechanisms can be locally validated and because the emissions offsets are immediate, and not projected savings from uncertain investments, the city is able to leverage market forces to produce tangible results over a relatively short time horizon.
To make sure things go according to plan, the Tokyo Metropolitan Government verifies emissions data and trades on a rolling basis. Non-compliant facilities are given warnings and, if goals are not met after the orders are given, a fine is issued that correlates to their shortfall.
With regards to the credit allotments themselves, the city has committed to aggressive reductions that keep the price of emissions competitive enough to take advantage of market forces. For the implementation period of 2010 to 2019, the city requires an emissions reduction of 15 percent. Additionally, credits are assigned based on an absolute emissions cap, not an intensity-based target. Intensity-based targets, which are widely used, offer credits for efficiency: emissions are permissible provided that a business emits only X CO2 relative to Y total output.
While efficiency is important, Tokyo only issues credits for efforts that result in a net emissions reduction, which makes its market exceptionally concrete.
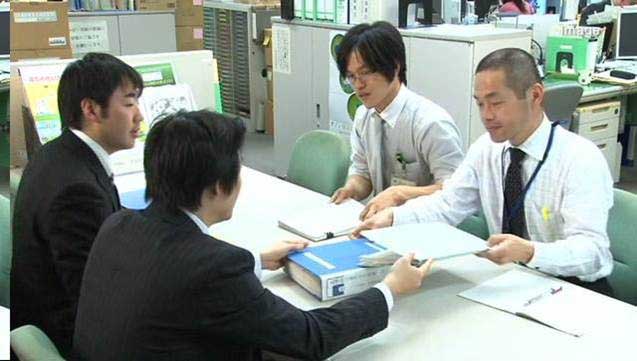
Validators in the Tokyo Metropolitan Government play an important role in making sure that emissions reports and trades are accurate.
What’s Next for Urban Emissions Trading
While the Tokyo Metropolitan Government has demonstrated success with its own domestic program, the system it has developed has potential beyond the borders of the Japanese capital region. Tokyo and Saitama Prefecture (home to ICLEI Member Saitama City) have signed an emission trade agreement that allows the trade of credits between the two cities thanks to the use of independent validation agencies, and such cooperation could be just the beginning for Japanese cities.
Tokyo hopes to encourage other major Japanese cities “to introduce a sub-national level cap-and-trade program,” and the city has reported interest from other cities in establishing such programs. If these markets become well-established and integrated, they could become the basis for a de facto national mechanism to secure climate finance and push for technological innovation.
As it stands, the market established by Tokyo is already well aligned with national goals. According to Japan’s intended nationally determined contribution (INDC), the national government has stressed the promotion of efficient industrial and construction processes to reduce emissions overall. In other words, the national government wants to promote things that are very similar to what the Tokyo Metropolitan Government credits in its market system. There are also signs that local governments are ready to adopt much of Tokyo’s ambition and add their own: Japan has been the site of four different Talanoa Dialogues, and is home to the Japan Climate Initiative, which unites diverse stakeholders — including major businesses — in joint climate action.
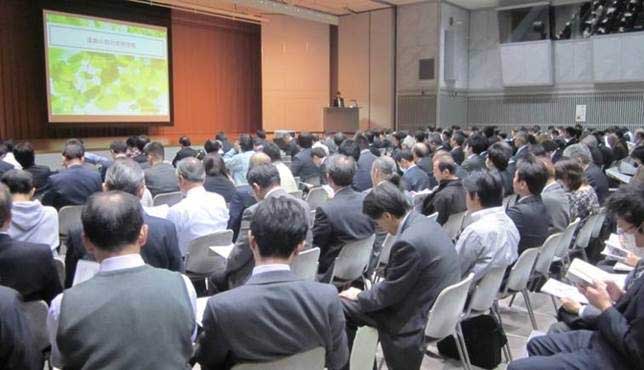
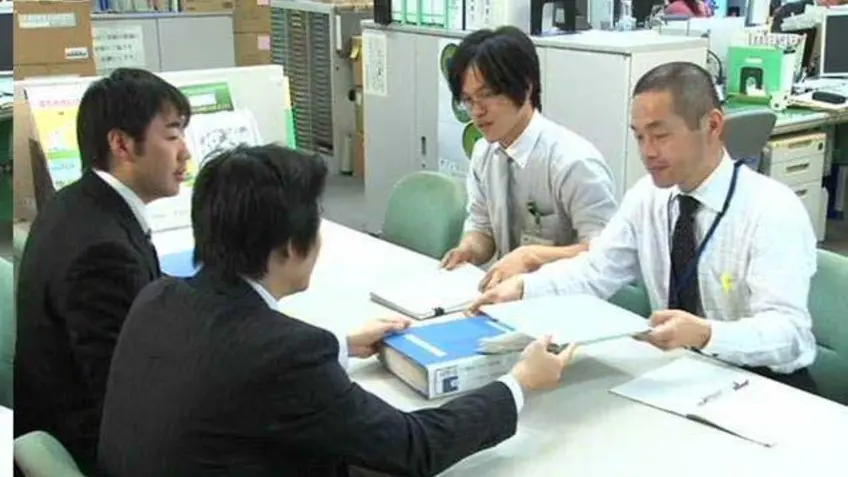
A seminar from the Tokyo Metropolitan Government on domestic emissions trading is attended by cities throughout the nation.
While there is currently no explicit plan for linking national climate strategy to local efforts, the work of Tokyo and environmentally-minded leaders, like Governor Yuriko Koike, show how local and regional governments can strengthen the national climate position in advance. Even if no direct cooperation occurs, sub-national emissions markets can both achieve the national emissions goals and provide valuable, validated information that can provide an accurate picture of where emissions come from, and why. Tokyo, as a Member of ICLEI, has already been very active in that field after helping develop a national supplement to the carbon reporting platform that now captures and reflects approximately 80 percent of Japan’s emissions sources.
The IPCC’s Special Report on 1.5 Degrees, published in 2018 shows that time is running out to achieve the goals of the Paris Agreement, stating with “high confidence” that planetary warming will exceed the 1.5 degree benchmark between 2030 and 2050 if changes are not made to shift the trajectory of emissions production worldwide. As nations move to increase their targets for the 2020 NDCs, the active engagement and leadership of cities like Tokyo, Saitama City and others can provide the foundation for the most ambitious possible goals. As Tokyo prepares to host the U20 Summit which is one of the engagement groups of the G20 Japan Presidency and establish an eco-conscious plan for the 2020 Olympics (including the “Zero Carbon Days”), nations will have the opportunity to see just what role cities can play.
This blog was written by ICLEI, with contributions from Yoko Kawai (ICLEI Japan Office) and Jisun Hwang (ICLEI World Secretariat), and is part of the Partner Spotlight series to highlight the work of our members in accelerating NDC implementation for climate and development action. ICLEI is a member of the NDC Partnership.
----Notes----
Relationship to https://www4.unfccc.int/sites/ndcstaging/PublishedDocuments/Japan%20First/20150717_Japan%27s%20INDC.pdf